Planta 235: 137-151 (2012)
|
Dose- and tissue-specific interaction of monoterpenes with the gibberellin-mediated release of potato tuber bud dormancy, sprout growth and induction of α-amylases and β-amylases
|
Sonja Rentzsch • Dagmara Podzimska • Antje Voegele • Madeleine Imbeck • Kerstin Müller§ • Ada Linkies* • Gerhard Leubner-Metzger*
*shared corresponding authors
|
University of Freiburg, Faculty of Biology, Institute for Biology II, Botany / Plant Physiology, Schänzlestr. 1, D-79104 Freiburg, Germany, Web: 'The Seed Biology Place' http://www.seedbiology.de
§Department of Biological Sciences, Simon Fraser University, 9 8888, University Drive, Burnaby BC, V5A 1S6, Canada
Received 11 June 2011; Accepted 5 August 2011;
Published online 20 August 2011
DOI: 10.107/s00425-011-1501-1
|
 |
 |
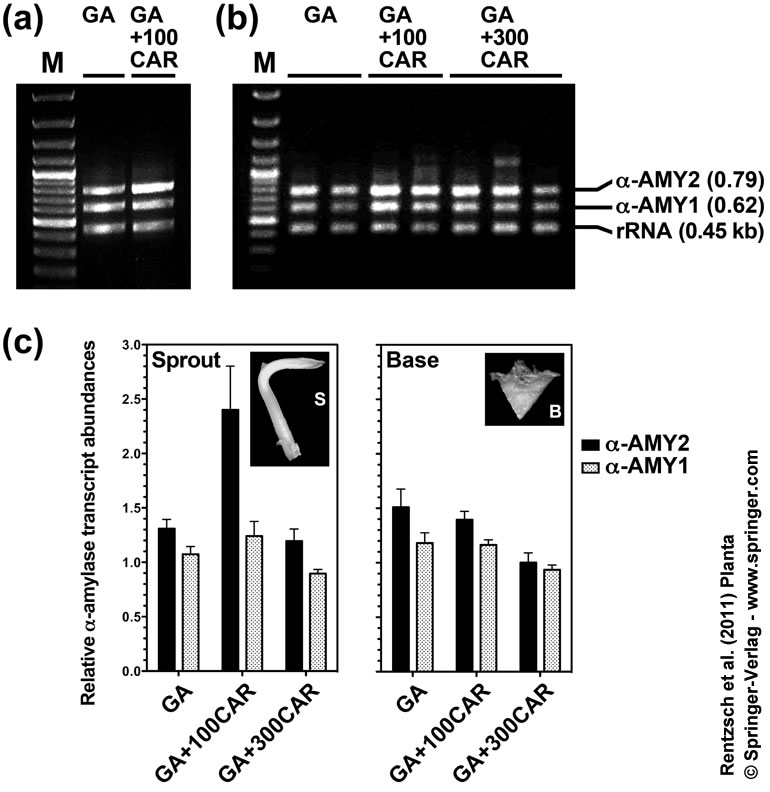
Fig. 5 RT-PCR analysis of the dose-dependent effects of S-(+)-carvone (CAR) on the gibberellin-mediated induction of α-AMY2- and α-AMY-type a-amylase transcripts in specific tissues of tuber bud discs from Solanum tuberosum cv. Agria.
Tuber bud discs were treated for 2h with 50 µM gibberellin A3 (GA) and, as indicated, with 100 or 300 µM CAR, and subsequently incubated for 7 days. RNA was isolated from sprout (S) and base (B) tissues and semi-quantitative RT-PCR with three primer pairs was conducted as described in the methods.
(a) The two group-specific α-amylase primer pairs amplified a 0.8-kb α-AMY2- and a 0.6-kb α-AMY1-fragment, while the rRNA primer pair amplified a 0.45-kb fragment. Compared to the GA-treated RNA sample from sprouts, the sprout sample treated with ‘GA+100CAR’ shows an ca. 2-fold enhanced abundance of the α-AMY2-band, while the α-AMY1- and rRNA-bands are similar in intensity between the two samples.
(b) An independent experiment with sprout RNA confirmed that low-CAR treatment (‘GA+100CAR’) caused enhanced α-AMY2-bands compared to ‘GA’, while this effect was not evident for α-AMY1. It showed in addition that the enhancing effect on the α-AMY2-bands is not evident with high-CAR treatment (‘GA+300CAR’).
(c) Quantification of the gel band intensities of the 0.79 kb α-AMY2, 0.62 kb α-AMY1, and the 0.45 kb rRNA PCR fragments. The relative values for each lane, α-AMY2/rRNA and α-AMY1/rRNA, were determined as a measure for the transcript abundances of α-AMY2- and α-AMY1-type α-amylases. The mean values ± SE presented are from the experiment shown partly in (b) and are based on at least 2-3 RNA samples (biological replicates) and three sqRT-PCR repetitions (technical replicates). Note that 25 cycles were used in the sqRT-PCR and that this was verified to be in the exponential phase as described in detail in the methods.
|
|
|
|
|